


| 3Q19 | 2Q19 | 1Q19 | 4Q18 | 3Q18 | 2Q18 | 1Q18 | 4Q17 | 3Q17 | 2Q17 | 1Q17 | 4Q16 | 3Q16 | 2Q16 | 1Q16 | 4Q15 | 3Q15 | 2Q15 | 1Q15 | 4Q14 | 3Q14 | 2Q14 | 1Q14 | 4Q13 | 3Q13 | 2Q13 | 1Q13 | 4Q12 | 3Q12 | 2Q12 | 1Q12 | 4Q11 | 3Q11 | 2Q11 | 1Q11 | |
|---|---|---|---|---|---|---|---|---|---|---|---|---|---|---|---|---|---|---|---|---|---|---|---|---|---|---|---|---|---|---|---|---|---|---|---|
| Consolidated | Consolidated | Consolidated | Consolidated | Consolidated | Consolidated | Consolidated | Consolidated | Consolidated | Consolidated | Consolidated | Consolidated | Consolidated | Consolidated | Consolidated (Restated) |
Consolidated | Consolidated | Consolidated | Consolidated (Restated) |
Consolidated | Consolidated | Consolidated | Consolidated (Restated) |
Consolidated | Consolidated | Consolidated | Consolidated (Restated) |
Consolidated (Restated) |
Consolidated (Restated) |
Consolidated (Restated) |
Consolidated | Cosolidated | Consolidated | Consolidated | Consolidated | |
Operationg Results |
|||||||||||||||||||||||||||||||||||
| Revenues from sales | 4,847.7 | 5,087.7 | 5,511.9 | 5,382.3 | 5,215.6 | 5,056.5 | 5,608.5 | 5,162.3 | 4,783.1 | 4,702.3 | 5,166.7 | 4,844.0 | 4,640.9 | 4,771.3 | 5,191.9 | 4,962.8 | 4,379.3 | 4,469.8 | 4,987.8 | 4,871.3 | 4,255.8 | 4,238.2 | 4,516.0 | 4,520.4 | 3,998.1 | 4,071.9 | 4,391.7 | 3,955.3 | 3,372.4 | 3,443.7 | 3,617.8 | 2,967.8 | 2,713.2 | 2,568.0 | 2,914.1 |
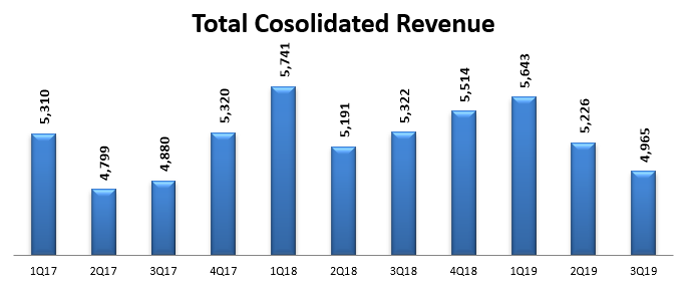
| Total revenues 1) | 4,964.7 | 5,225.6 | 5,643.0 | 5,514.2 | 5,321.6 | 5,191.1 | 5,741.3 | 5,320.4 | 4,880.1 | 4,799.3 | 5,345.7 | 4,964.1 | 4,743.1 | 4,868.5 | 5,330.6 | 5,021.5 | 4,553.1 | 4,550.1 | 5,168.7 | 4,993.0 | 4,395.5 | 4,361.9 | 4,650.2 | 4,624.4 | 4,095.3 | 4,236.3 | 4,513.6 | 4,073.9 | 3,467.9 | 3,558.9 | 3,728.5 | 3,042.7 | 2,800.1 | 2,632.0 | 2,999.1 |
| Gross profit | 2,631.4 | 2,792.3 | 3,255.0 | 3,008.9 | 2,939.8 | 2,795.4 | 3,360.2 | 2,928.8 | 2,693.8 | 2,617.6 | 3,075.3 | 2,739.1 | 2,545.3 | 2,632.3 | 3,111.1 | 2,825.3 | 2,423.3 | 2,485.8 | 2,987.6 | 2,807.0 | 2,317.2 | 2,245.1 | 2,655.8 | 2,552.8 | 2,195.3 | 2,231.3 | 2,601.3 | 2,199.2 | 1,793.5 | 1,843.6 | 2,115.6 | 1,631.6 | 1,435.6 | 1,332.3 | 1,688.8 |
| EBITDA | 800.4 | 906.7 | 1,497.6 | 1,199.3 | 1,113.8 | 1,003.2 | 1,587.6 | 1,174.3 | 1,024.7 | 889.1 | 1,491.0 | 1,082.0 | 939.4 | 902.7 | 1,483.4 | 1,049.1 | 874.0 | 865.4 | 1,508.5 | 1,086.5 | 745.5 | 662.7 | 1,196.0 | 910.4 | 839.9 | 766.6 | 1,279.6 | 743.8 | 553.1 | 665.0 | 1,055.1 | 574.0 | 480.2 | 452.9 | 858.4 |
| Core Net profit (loss) 2) | 215.0 | 290.5 | 745.3 | 485.0 | 441.7 | 371.7 | 883.0 | 506.5 | 368.5 | 398.3 | 747.1 | 449.3 | 296.6 | 322.4 | 757.7 | 392.1 | 293.6 | 246.2 | 833.8 | 409.7 | 168.0 | 41.6 | 501.9 | 314.9 | 194.0 | 201.1 | 649.0 | 409.2 | 11.9 | 130.6 | 509.8 | 122.9 | 31.9 | 42.5 | 408.1 |
| Net profit | 215.0 | 232.4 | 825.9 | 481.1 | 441.7 | 371.7 | 883.0 | 441.6 | 368.5 | 398.3 | 783.0 | 415.9 | 321.9 | 354.0 | 757.7 | 289.9 | 293.6 | 246.2 | 833.8 | 477.0 | 168.0 | 41.6 | 501.9 | 314.9 | 194.0 | 188.7 | 649.0 | 631.9 | 11.9 | 113.1 | 838.9 | 75.0 | 31.9 | 42.5 | 400.9 |
Financial Position |
30-Sep-19 | 30-Jun-19 | 31-Mar-19 | 31-Dec-18 | 30-Sep-18 | 30-Jun-18 | 31-Mar-18 | 31-Dec-17 | 30-Sep-17 | 30-Jun-17 | 31-Mar-17 | 31-Dec-16 | 30-Sep-16 | 30-Jun-16 | 31-Mar-16 | 31-Dec-15 | 30-Sep-15 | 30-Jun-15 | 31-Mar-15 | 31-Dec-14 | 30-Sep-14 | 30-Jun-14 | 31-Mar-14 | 31-Dec-13 | 30-Sep-13 | 30-Jun-13 | 31-Mar-13 | 31-Dec-12 (Restated) |
30-Sep-12 | 30-Jun-12 | 31-Mar-12 | 31-Dec-11 | 30-Sep-11 | 30-Jun-11 | 31-Mar-11 |
| Total assets | 26,450.7 | 26,093.2 | 27,068.6 | 26,447.4 | 25,578.4 | 25,099.6 | 25,509.6 | 25,037.3 | 24,073.2 | 23,799.7 | 24,974.3 | 24,396.8 | 24,230.8 | 24,489.7 | 24,713.3 | 24,443.5 | 27,993.9 | 27,761.0 | 28,255.4 | 24,769.9 | 27,785.4 | 27,899.8 | 28,540.5 | 29,224.4 | 27,782.0 | 27,851.3 | 27,884.6 | 28,149.1 | 22,735.1 | 22,771.1 | 22,652.0 | 21,683.6 | 21,297.4 | 20,623.3 | 20,578.2 |
| Total liabilities | 12,745.2 | 12,566.7 | 12,806.6 | 13,027.8 | 12,664.3 | 12,545.0 | 12,592.1 | 12,978.9 | 12,453.5 | 12,516.4 | 13,303.5 | 13,279.5 | 13,550.5 | 14,081.1 | 13,964.8 | 14,522.7 | 15,494.3 | 15,549.0 | 15,689.6 | 16,038.4 | 16,580.6 | 16,849.2 | 16,914.4 | 18,006.6 | 17,623.7 | 17,822.6 | 17,646.1 | 18,219.6 | 15,822.3 | 15,905.7 | 15,880.0 | 15,634.9 | 15,321.8 | 14,474.6 | 14,474.6 |
| Interest bearing debts | 7,215.5 | 6,970.0 | 6,977.6 | 7,075.8 | 6,965.6 | 6,884.5 | 6,839.1 | 6,965.2 | 7,767.6 | 7,135.1 | 7,851.0 | 7,767.0 | 8,117.9 | 8,589.6 | 8,311.0 | 8,699.0 | 9,048.1 | 9,190.0 | 9,212.0 | 10,256.2 | 10,290.0 | 10,617.0 | 10,756.0 | 11,507.8 | 11,498.5 | 11,912.0 | 11,631.8 | 12,053.6 | 10,606.8 | 10,732.3 | 10,498.4 | 9,456.9 | 10,074.3 | 9,657.8 | 9,324.5 |
| Shareholders' equity | 13,705.5 | 13,526.5 | 14,262.0 | 13,419.7 | 12,914.7 | 12,554.6 | 12,917.5 | 12,058.4 | 11,619.6 | 11,283.3 | 11,670.8 | 11,117.3 | 10,680.3 | 10,408.6 | 10,748.5 | 9,920.8 | 12,499.5 | 12,211.9 | 12,565.8 | 8,731.5 | 11,204.7 | 11,050.6 | 11,626.1 | 11,217.8 | 10,158.2 | 10,028.7 | 10,238.5 | 9,929.4 | 6,912.8 | 6,865.4 | 6,771.9 | 6,048.6 | 5,975.6 | 6,103.6 | 6,103.6 |
| Retained earnings3) | 10,847.2 | 10,632.2 | 11,277.2 | 10,451.3 | 9,987.7 | 9,546.0 | 9,984.2 | 9,101.2 | 8,659.6 | 8,291.8 | 8,635.3 | 7,852.3 | 7,469.8 | 7,147.9 | 7,468.7 | 6,677.6 | 6,459.7 | 6,166.1 | 6,459.9 | 5,626.0 | 5,078.6 | 4,910.7 | 5,409.0 | 4,977.5 | 4,478.2 | 4,284.2 | 4,500.6 | 2,536.4 | 2,558.0 | 2,454.3 | 2,493.0 | 1,927.4 | 1,852.4 | 1,820.5 | 1,845.5 |
| Weighted Average Number of ordinary shares (million shares) | 1,350.0 | 1,350.0 | 1,350.0 | 1,350.0 | 1,350.0 | 1,350.0 | 1,350.0 | 1,350.0 | 1,350.0 | 1,350.0 | 1,350.0 | 1,350.0 | 1,350.0 | 1,350.0 | 1,350.0 | 1,350.0 | 1,350.0 | 1,350.0 | 1,350.0 | 1,350.0 | 1,350.0 | 1,350.0 | 1,350.0 | 1,350.0 | 1,350.0 | 1,350.0 | 1,350.0 | 1,350.0 | 1,350.0 | 1,350.0 | 1,350.0 | 1,350.0 | 1,350.0 | 1,350.0 | 1,350.0 |
Key Financial Ratios |
|||||||||||||||||||||||||||||||||||
| Core Net profit margin (%) | 4.3% | 5.6% | 13.2% | 8.8% | 8.3% | 7.2% | 15.4% | 9.5% | 7.6% | 8.3% | 14.1% | 9.1% | 6.3% | 6.6% | 14.2% | 7.8% | 6.4% | 5.4% | 16.1% | 8.2% | 3.8% | 1.0% | 10.8% | 6.8% | 4.7% | 4.7% | 14.4% | 10.0% | 0.3% | 3.7% | 13.7% | 4.0% | 1.1% | 1.6% | 13.6% |
| Return on assets (%)4) | 6.6% | 7.5% | 7.6% | 8.2% | 8.6% | 8.5% | 8.5% | 8.1% | 8.2% | 7.9% | 7.3% | 7.5% | 7.3% | 7.2% | 6.8% | 7.2% | 6.4% | 6.0% | 5.1% | 4.5% | 3.7% | 3.8% | 4.2% | 4.7% | 5.2% | 4.6% | 4.3% | 3.8% | 3.4% | 3.5% | 3.1% | 2.8% | 2.7% | 1.9% | 0.8% |
| Return on equity (%)3), 4) | 12.7% | 14.5% | 14.3% | 16.3% | 17.1% | 17.0% | 16.7% | 16.8% | 16.9% | 16.8% | 15.6% | 16.4% | 16.6% | 17.0% | 15.7% | 17.8% | 14.3% | 13.6% | 11.6% | 12.8% | 9.2% | 9.5% | 10.4% | 12.1% | 14.3% | 12.7% | 11.7% | 10.7% | 11.2% | 11.6% | 10.4% | 10.0% | 9.6% | 6.5% | 2.7% |
| Interest bearing debts / Equity (times) | 0.53 | 0.52 | 0.49 | 0.53 | 0.54 | 0.55 | 0.53 | 0.58 | 0.67 | 0.63 | 0.67 | 0.70 | 0.76 | 0.83 | 0.77 | 0.88 | 0.72 | 0.75 | 0.73 | 1.17 | 0.92 | 0.96 | 0.93 | 1.03 | 1.13 | 1.19 | 1.14 | 1.21 | 1.53 | 1.56 | 1.55 | 1.56 | 1.69 | 1.58 | 1.53 |
| Total liabilities / Equity (times) | 0.93 | 0.93 | 0.90 | 0.97 | 0.98 | 1.00 | 0.97 | 1.08 | 1.07 | 1.11 | 1.14 | 1.19 | 1.27 | 1.35 | 1.30 | 1.46 | 1.24 | 1.27 | 1.25 | 1.84 | 1.48 | 1.52 | 1.45 | 1.61 | 1.73 | 1.78 | 1.72 | 1.83 | 2.29 | 2.32 | 2.34 | 2.58 | 2.56 | 2.37 | 2.37 |
| Core Earnings (loss) per share (Baht) | 0.16 | 0.22 | 0.55 | 0.36 | 0.33 | 0.28 | 0.65 | 0.38 | 0.27 | 0.30 | 0.55 | 0.33 | 0.22 | 0.24 | 0.56 | 0.29 | 0.22 | 0.18 | 0.62 | 0.30 | 0.12 | 0.03 | 0.37 | 0.23 | 0.14 | 0.15 | 0.48 | 0.30 | 0.01 | 0.10 | 0.38 | 0.09 | 0.02 | 0.03 | 0.30 |
| Earnings (loss) per share (Baht) | 0.16 | 0.17 | 0.61 | 0.36 | 0.33 | 0.28 | 0.65 | 0.33 | 0.27 | 0.30 | 0.58 | 0.31 | 0.24 | 0.26 | 0.56 | 0.21 | 0.22 | 0.18 | 0.62 | 0.35 | 0.12 | 0.03 | 0.37 | 0.23 | 0.14 | 0.14 | 0.48 | 0.47 | 0.01 | 0.08 | 0.62 | 0.06 | 0.02 | 0.03 | 0.30 |