


|
Unit : Baht Million
|
||||||
| 2018 | 2017 | 2016 | 2015 | 2014 | ||
|---|---|---|---|---|---|---|
| Consolidated | Consolidated | Consolidated | Consolidated (Restated) |
Consolidated (Restated) |
||
Operationg Results |
||||||
| Revenues from sales 1) | 21,263.0 | 19,814.4 | 19,448.2 | 18,822.7 | 17,892.0 | |
| Total revenues | 21,768.2 | 20,345.5 | 19,906.2 | 19,216.1 | 18,282.8 | |
| Gross profit | 12,104.2 | 11,311.1 | 11,049.1 | 10,722.1 | 10,035.9 | |
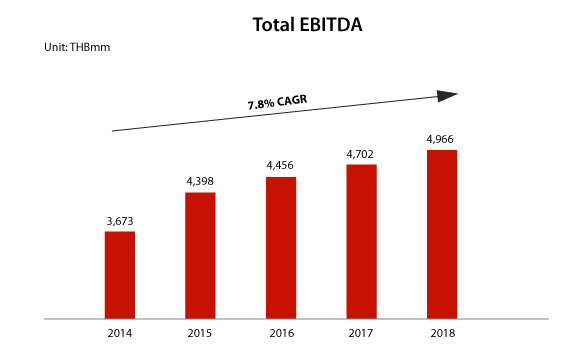
| EBITDA | 4,966.4 | 4,701.7 | 4,455.9 | 4,397.5 | 3,673.1 | |
| Core Net profit (loss) 2) | 2,181.5 | 2,056.3 | 1,851.4 | 1,765.8 | 1,154.8 | |
| Net profit | 2,177.6 | 1,991.4 | 1,849.6 | 1,663.6 | 1,188.5 | |
Financial Position |
||||||
| Total assets | 26,447.4 | 25,037.3 | 24,396.8 | 24,443.5 | 24,769.9 | |
| Total liabilities | 13,027.8 | 12,978.9 | 13,279.5 | 14,522.7 | 16,038.4 | |
| Interest bearing debts | 7,075.8 | 6,965.2 | 7,767.6 | 8,699.0 | 10,256.2 | |
| Shareholders' equity | 13,419.7 | 12,058.4 | 11,117.3 | 9,920.8 | 8,731.5 | |
| Retained earnings 3) | 10,451.3 | 9,101.2 | 7,852.3 | 6,677.6 | 5,626.0 | |
| Weighted Average Number of ordinary shares (million shares) | 1,350.0 | 1,350.0 | 1,350.0 | 1,350.0 | 1,350.0 | |
Key Financial Ratios |
||||||
| Core Net profit margin (%) | 10.0% | 10.1% | 9.3% | 9.1% | 6.8% | |
| Return on assets (%) 4) | 8.2% | 8.2% | 7.6% | 7.2% | 5.1% | |
| Return on equity (%) 3), 4) | 16.3% | 17.1% | 16.7% | 17.8% | 14.4% | |
| Interest bearing debts / Equity (times) | 0.53 | 0.58 | 0.70 | 0.88 | 1.17 | |
| Total liabilities / Equity (times) | 0.97 | 1.08 | 1.19 | 1.46 | 1.84 | |
| Core Earnings (loss) per share (Baht) | 1.62 | 1.52 | 1.37 | 1.31 | 0.93 | |
| Earnings (loss) per share (Baht) | 1.61 | 1.48 | 1.37 | 1.23 | 0.88 | |
Noted: